Learn the difference between CAGR and SIP returns and how to measure investment performance using the right calculator.
Link copied to clipboard!
Researched and written using standard financial formulas and the available article context.
Turn this guide into numbers with: SDP Calculator - Interest & Maturity Value | SIP Calculator - Monthly Investment Returns | EMI Calculator - Loan Monthly Payment
Hi, my name is Kush, and through analyzing multiple investment scenarios and real-world portfolios, I’ve noticed something important—many of us hesitate when it comes to calculating returns correctly.
Even when investments grow, there’s often confusion around whether the performance is actually good or just appears so due to how it’s measured.
This usually happens because different investment styles like SIP and lump sum are evaluated using the same metric, which can quietly distort reality.
In this article, I’ll break this down in a simple and practical way, so you can measure your investments with clarity and make more confident financial decisions.
Investors often look at their portfolio statements and feel uncertain about what the numbers truly mean. A steady monthly investment may show a healthy balance, while a one-time investment might display a neat percentage return. Comparing the two often leads to confusion rather than clarity.
The misunderstanding usually comes from assuming that all returns are measured the same way. When different investment styles are judged using a single lens, conclusions can quietly drift off course.
This gap between effort, time, and reported performance is where many investors lose confidence in their own decisions.
Understanding the difference without technical framing
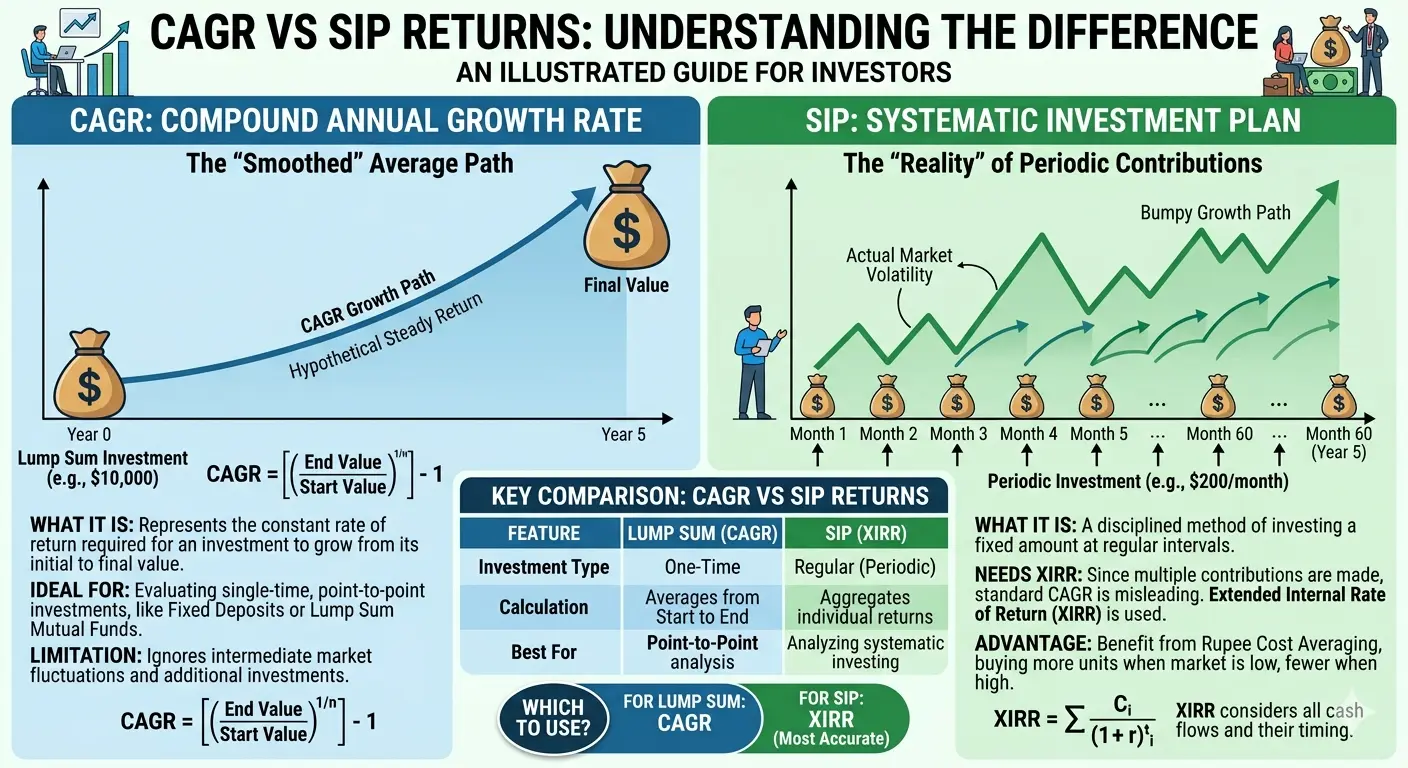
Different investments follow different cash flow patterns. Some involve a single amount invested at once, while others build gradually over time.
Because money enters the market at different points, measuring growth requires context. A single percentage cannot always describe both experiences accurately.
Why these returns are often confused
Performance numbers are usually presented without explaining what they actually represent. A clean percentage feels definitive, even when the underlying method differs.
This is where most people get surprised. Two returns that look similar may reflect entirely different investment realities once timing is considered.
Why this distinction matters for real decisions
Understanding performance correctly influences whether an investment feels successful or disappointing. Misreading returns can lead to unnecessary strategy changes or misplaced confidence.
When you calculate it using the right framework, expectations align more closely with reality, supporting better long-term choices.
The role of time and consistency
Regular investing introduces a rhythm. Each contribution experiences the market differently, which shapes overall performance in a way lump-sum investing does not.
When you calculate it, the pattern becomes clearer. Time and consistency redefine what growth actually means.
A realistic investing situation
Imagine comparing a long-running monthly plan with a one-time investment made years ago. Both show gains, but the journeys are fundamentally different.
Looking deeper reveals why direct comparison can be misleading. Numbers often reveal what assumptions hide when timing is acknowledged.
Common mistakes in performance comparison
- Comparing regular investments with lump sums using a single metric
- Ignoring when money was actually invested
- Assuming higher percentages always indicate better outcomes
- Making decisions based on headline figures alone
These errors usually stem from oversimplification rather than lack of understanding.
How this differs from other evaluation methods
Some measures focus on annualized growth, others on cash flow-weighted outcomes. Each serves a different purpose.
Knowing which lens to apply helps translate numbers into insight instead of noise.
Using calculators for clearer insight
Calculators work best as interpretation tools rather than scorecards. Exploring scenarios helps align the method with the investment style.
Clarity emerges when the right measure is applied to the right situation, turning abstract percentages into meaningful understanding.
The psychological side of measuring performance
Misunderstood returns often trigger unnecessary doubt or overconfidence. Clear measurement reduces emotional reactions and improves patience.
Confidence grows from understanding, not comparison. Trying different scenarios with the calculator supports long-term thinking and encourages decisions grounded in clarity rather than assumption.
Trending Articles
- Ring Fence Calculator Explained: How to Protect Your Financial Goals
- Compound Interest Calculator: How Your Money Grows Over Time
- How to Split Loan EMI Between Co-Borrowers: Calculator & Examples
- CAGR Calculator Guide: Measure Real Investment Growth Accurately
- EMI Split Calculator Explained: Split Loan EMIs Equally or by Custom Percentage
- RD Ladder Calculator Explained: How to Build a Staggered Savings Plan