Compare CAGR vs absolute returns to understand which metric shows real investment growth and performance more accurately.
Link copied to clipboard!
Researched and written using standard financial formulas and the available article context.
Turn this guide into numbers with: SDP Calculator - Interest & Maturity Value | SIP Calculator - Monthly Investment Returns | EMI Calculator - Loan Monthly Payment
Investment conversations often revolve around how much money was made. A portfolio that shows a large gain feels successful at first glance, and the discussion usually stops there. What often goes unasked is how long it took to achieve that result.
This gap between outcome and time creates confusion. Two investments can show the same growth on paper while telling very different stories beneath the surface.
Without a consistent way to look at both value and duration together, comparisons become misleading.
Understanding growth beyond the final number
Investment growth has two dimensions: how much it grew and how long it took. Looking at only one of these gives an incomplete picture.
One measure focuses on the total change from start to end. Another smooths that journey into an annualized pace, helping translate uneven progress into a comparable form.
Why this distinction is commonly misunderstood
Absolute gains feel concrete and easy to grasp. They answer a simple question about increase in value, which makes them attractive in casual comparisons.
This is where most people get surprised. A larger total gain does not always mean better performance once time is accounted for.
Why this clarity matters for real decisions
Choosing where to invest or whether to stay invested depends on understanding efficiency, not just outcome. Time-adjusted growth helps evaluate whether capital is being used effectively.
When you calculate it properly, performance comparisons become fairer and less influenced by headline numbers.
The role of time and compounding
Time quietly amplifies differences. Small variations in annual pace can create wide gaps over longer periods, while strong short-term gains may lose their impact when stretched out.
When you calculate it, the pattern becomes clearer. Duration reshapes how success should be interpreted.
A practical comparison scenario
Imagine two investments ending at similar values. One reached there steadily over time, the other experienced sharp movements before settling.
Looking only at the final figure suggests similarity. Numbers often reveal what assumptions hide when growth is aligned with time.
Common mistakes in comparing returns
- Judging performance only by total gain
- Ignoring differences in holding period
- Comparing investments with unequal timelines
- Assuming higher absolute return means better efficiency
These mistakes usually arise from oversimplifying complex journeys.
How this comparison differs from other tools
Point-to-point return highlights change. Annualized growth highlights pace. Together, they provide context that neither can offer alone.
This combined view is especially useful when evaluating opportunities with different durations.
Using the calculator for better perspective
The calculator works best as a comparison aid. Adjusting time and values helps translate outcomes into a consistent framework.
Exploration brings insight. Instead of relying on intuition, clarity emerges through aligned measurement.
The psychological side of return comparison
Clear metrics reduce emotional bias. They prevent overconfidence driven by large numbers and disappointment caused by slow-looking progress.
Understanding both total and time-adjusted growth supports calmer decisions. Trying different scenarios with the calculator reinforces long-term thinking and builds confidence grounded in clarity rather than assumption.
Trending Articles
- Ring Fence Calculator Explained: How to Protect Your Financial Goals
- Compound Interest Calculator: How Your Money Grows Over Time
- How to Split Loan EMI Between Co-Borrowers: Calculator & Examples
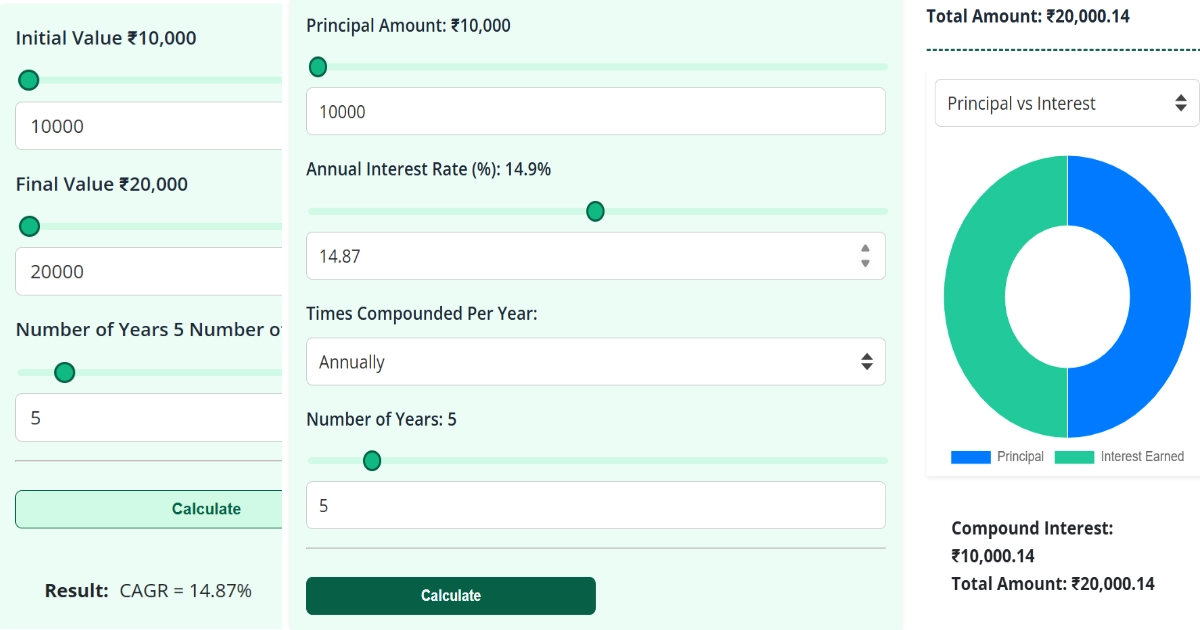
- CAGR Calculator Guide: Measure Real Investment Growth Accurately
- EMI Split Calculator Explained: Split Loan EMIs Equally or by Custom Percentage
- RD Ladder Calculator Explained: How to Build a Staggered Savings Plan